If you’re just beginning to learn about Google Analytics 4, getting started shouldn’t be as daunting as tackling the difficult puzzle. In this tutorial, you’ll discover how to set up a tracking program, track the most important interactions, and use all the important reports. It will transform the page views, clicks, and submission forms into clear information to help you optimize your campaigns, monitor the conversion rate, and demonstrate the real ROI without any technical hassles.
Google Analytics Tutorial: Step-by-Step Guide for Marketers
Step 1: Set Up Your Account and Configure Your Property
The beginning is about setting the right base. If you do not follow the steps correctly, like an incorrect code snippet or an incorrectly configured data stream for your app, you will lose valuable information on active users as well as user interactions. Missing these crucial tracking elements will completely skew the accuracy of your shopping engine search reporting down the line.
Creating Your Google Analytics 4 Account
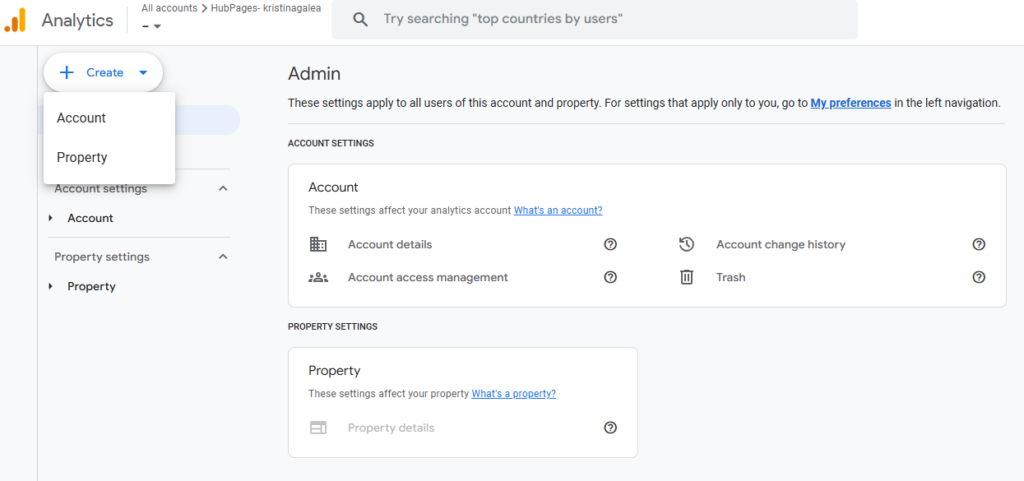
If you don’t have an account, go to the Google Analytics log-in page to create one. Then, in the “Admin” page, click the “Create” menu and select the “Property” option.
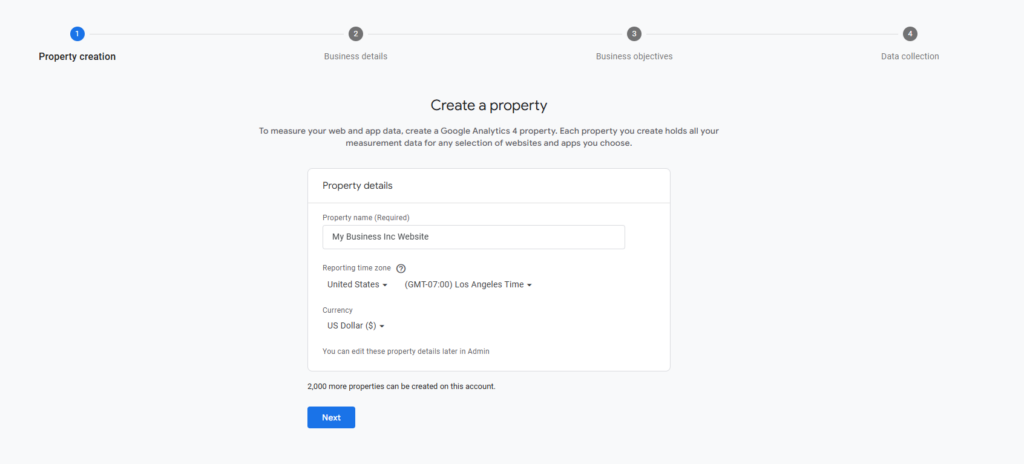
Once you’re on the “Create a property” page, you’ll need to enter your property name (example, “My Business Inc Website”) and select the reporting time zone and currency from the dropdown menu.
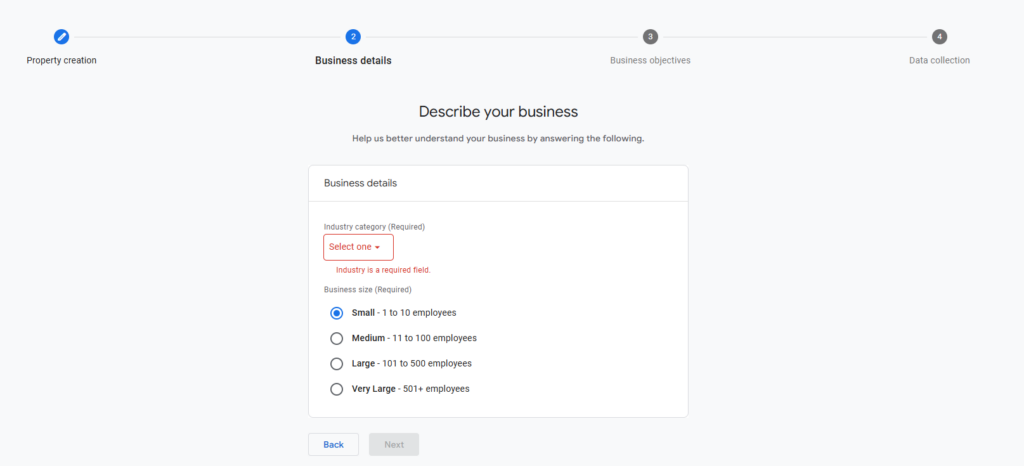
On the next page, you’ll be asked to provide details about your business. For example, you have to indicate the industry your business belongs to. Options range from arts and entertainment to finance, food and drink, and health. You also have to select your company size by indicating the number of employees you have.
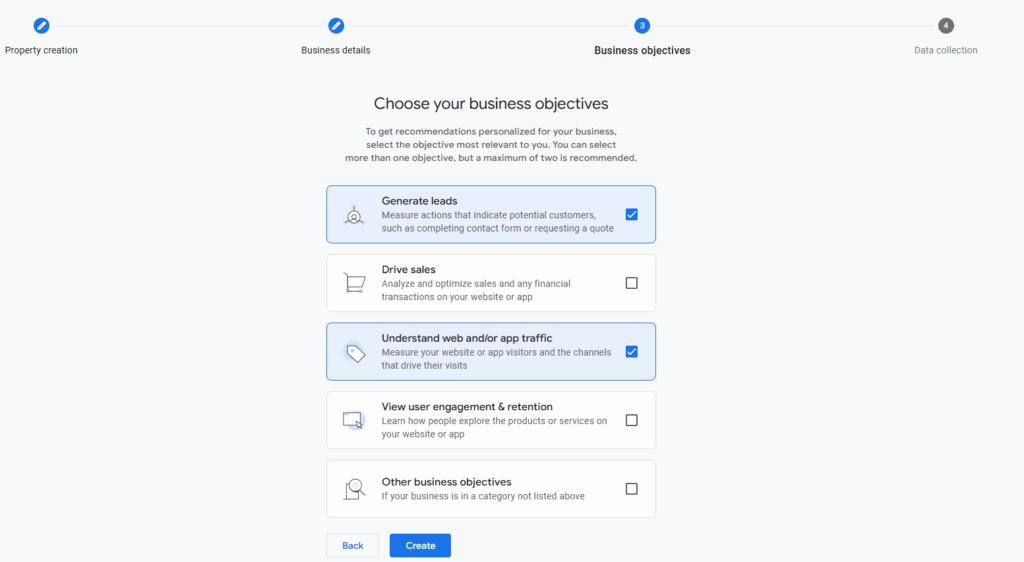
What are your business objectives? Is it to generate leads, increase sales, or monitor website traffic? On the next page, you can select up to two options relevant to your business, and you’ll start receiving personalized recommendations based on your selections.
After that, hit “Create”.
Adding a Data Stream
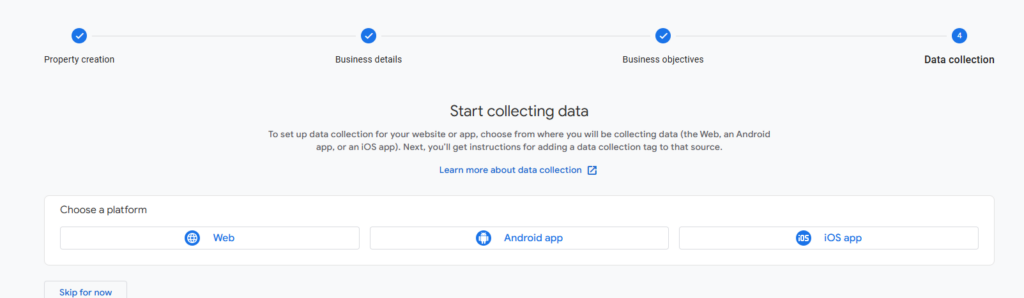
After creating your GA4 property, you can complete the ” Start Collecting Data ” page. This is where you add a data stream, which represents a data flow from a specific source (web or app) to your property. (Think of it as a channel through which data is collected and sent for analysis.)
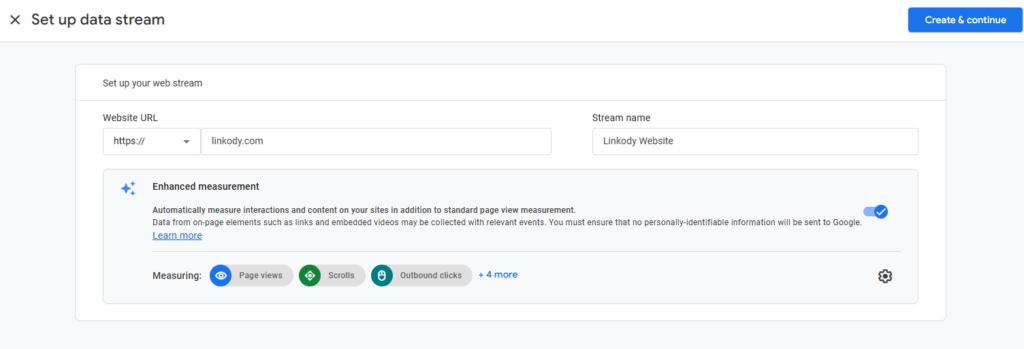
You must enter your website URL and stream name for a web stream.
Afterward, you can view all your data streams on your “data streams” tab.
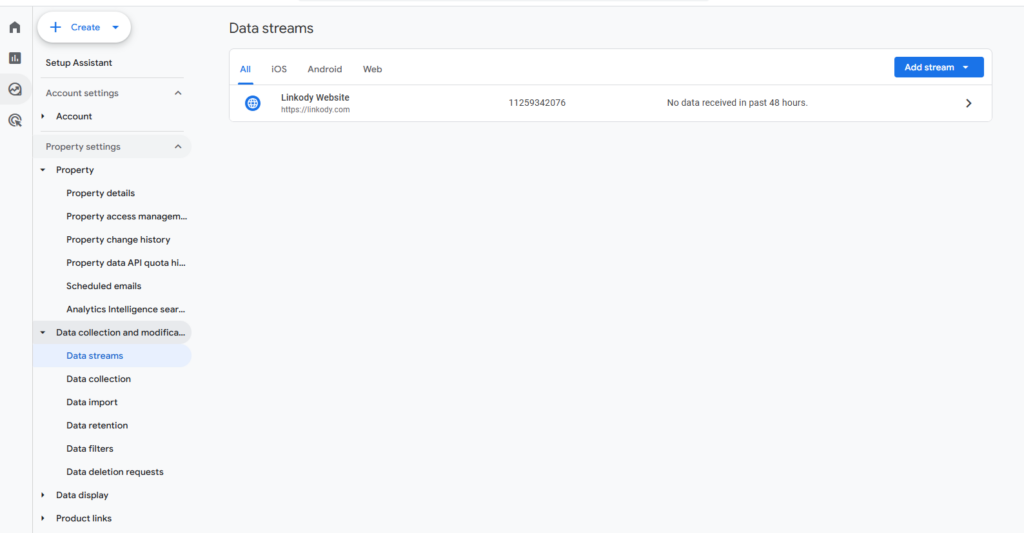
And, to view the stream’s information, just click the data stream you’ve just created, and you’ll find the stream URL, stream ID, and measurement ID.
Enable Enhanced Measurement
Enhanced measurement is a standard measurement that automatically tracks key events on your website once enabled:
- Outbound link clicks
- Video engagement
- Form interactions
- File downloads
- Page views
- Site search
- Scrolls
For data streams, enhanced measurement options can be toggled on or off globally or for individual event types (more on events in a bit).
Also, by enabling enhanced measurement, marketers gain actionable insights into visitor behavior, reducing setup time while capturing valuable data for marketing analytics.
Installing the Tracking Code
Google Analytics’ tracking code, also known as the GA tracking code, is a small snippet that Google Analytics provides and is added to a website’s HTML. With this code, you can track user activity on your website and gather information about how visitors react to your content.
Here are two options for installing the tracking code:
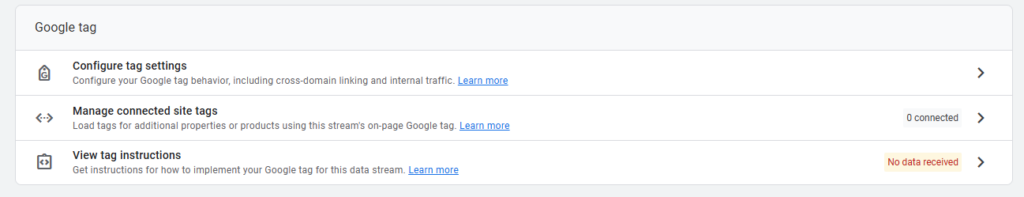
Option A: Google Tag (gtag.js)
View your data stream and open the “View tag instructions” page under “Google Tag”. Copy the snippet into your stream details, then paste it immediately before the </head> tag on every page.
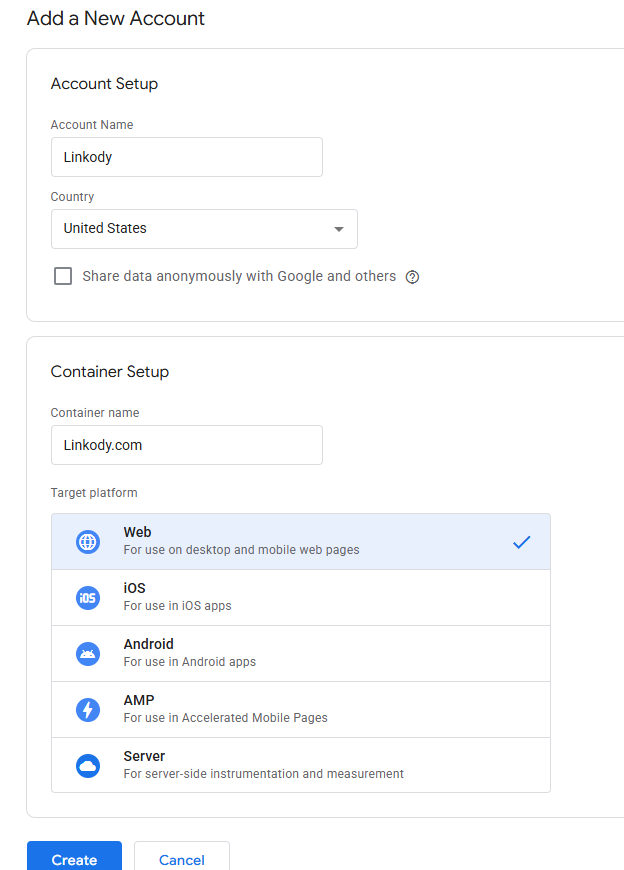
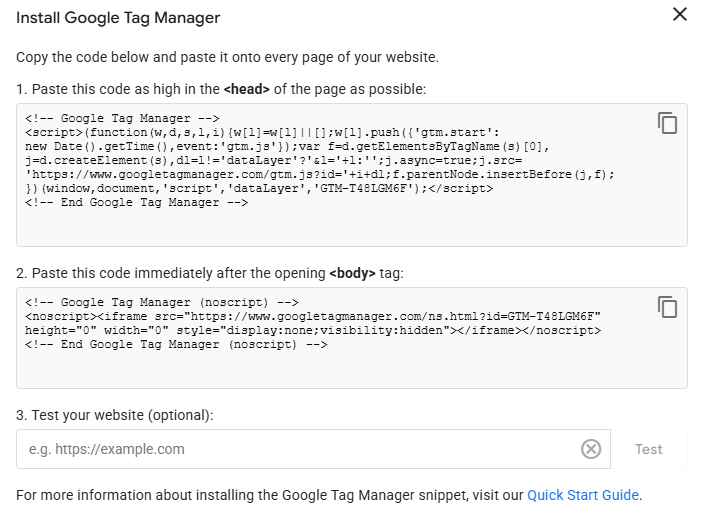
Option B: Google Tag Manager (GTM)
Create an account in your “Tag Manager” and enter your details.
Then, you’ll get the tracking code. Follow the instructions provided.
When designing your site, make sure that you have the tracker code properly installed. An error or omission could result in data loss as well as distorted information and missed opportunities. A well-planned setup will ensure you get exact, complete data right from the start that includes user behavior as well as traffic sources.
Think of it as laying the foundation for smarter marketing decisions, improved ROI, and a data-driven strategy that grows with your business.
Enter your website’s URL, right-click on the page, and select “View Page Source.” Then press Ctrl+F to search for your code.
Step 2: Master Event Tracking
In this section, we’ll discuss what events are and how they help you track user interaction.
Identifying and Understanding Events
Events (formerly known as “conversions”) serve as the basis for GA4’s data model. Each interaction with a user, whether it’s a page visit, a form submission, or a request for a quote, is logged in GA4 as an incident. For instance, the company that rents RVs can monitor how many customers make reservations and help determine which marketing channels generate the highest-quality leads. Without tracking conversions, you’re just trying to guess instead of focusing on actionable, real-time information.
So, let’s see the type of events you can collect automatically:
Automatically Collected Events
These are basic actions that are tracked by default as soon as you set up your GA4 account. Examples include:
- first_visit: It’s triggered when someone lands on a website or launches an app and Google Analytics is enabled.
- session_start: This is when a new user starts a new session on an app or website.
- app_clear_data: It’s when users delete all their app or settings data.
Enhanced Measurement Events
These are collected when you set up GA4 and turn on your enhanced measurement settings. These interactions could be:
- Scrolls: When users scroll to the end of a web page.
- Outbound clicks: When someone clicks a link that points to another website’s content.
- Video engagement: This is when someone engages with YouTube-embedded videos. For example, this event is triggered when a video starts playing or ends.
Recommended Events
These are predefined events that Google suggests for common business goals. For instance, you can track these events for any type of business:
- purchase: This is when someone makes a purchase.
- search: This is when a visitor uses your website’s search function to find something specific.
- tutorial_begin: This is when someone joins the onboarding process and begins a tutorial.
Custom Events
These include any other user actions you want to track by defining your own event names and parameters. This option can be helpful if, for example, you want to know when someone makes a donation.
However, remember that what works for one business may not work for another, which is why you have to decide which user actions matter most to you. That usually means looking past surface-level activity and focusing on the moments that show genuine intent. For many websites, Forms sit at that point in the journey, helping turn visits into inquiries, sign-ups, support requests, or other actions worth measuring. These could be:
- Form submissions (e.g., newsletter sign-ups)
- File downloads (e.g., whitepapers)
- Product clicks or add_to_cart actions
- Video engagements (e.g., plays, completions)
Knowing your key events helps you plan which actions to track by default, which to enable via enhanced measurement, and which to set up as custom events.
Creating Events
Now that you know how to identify event types, let’s see how to create your first event, with and without code.
Option A: Creating Events Without Code
First, go to your Google Analytics Admin page. Click Events, which you’ll find under “Data Display”.
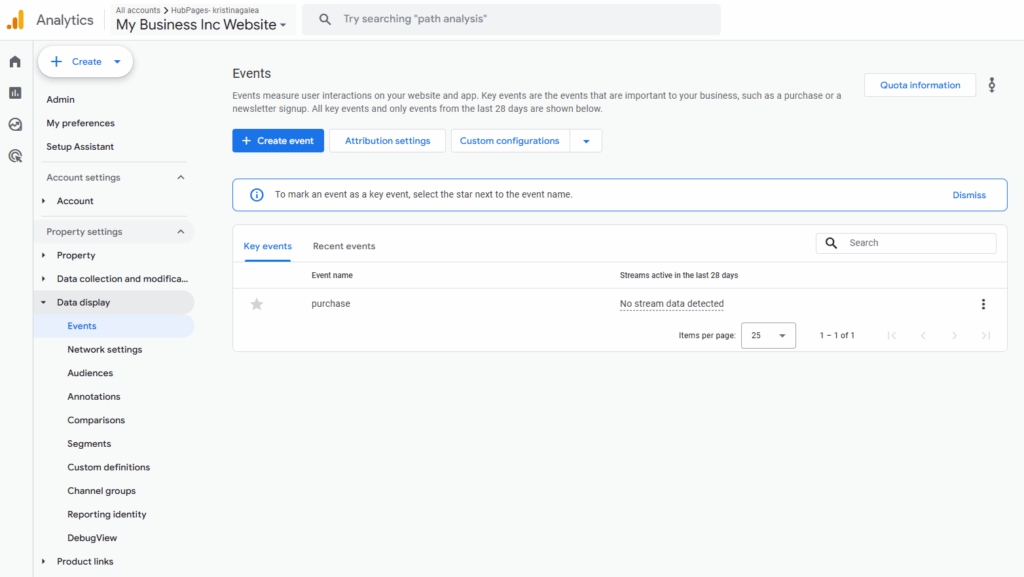
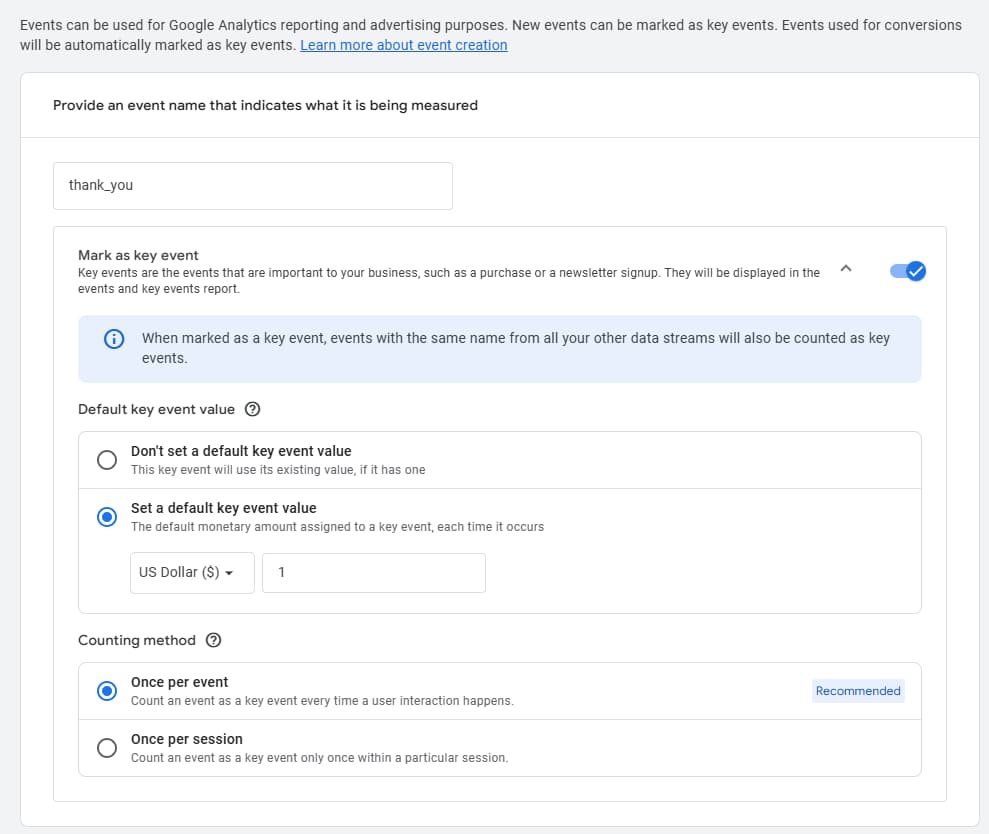
Then, click “Create Event”. You’ll be asked to write your event name in the “Event Name” field.
If you’d like, you can click the toggle next to the “Mark as key event” option. Under “Set a default key event value,” enter the monetary amount and indicate the counting method.
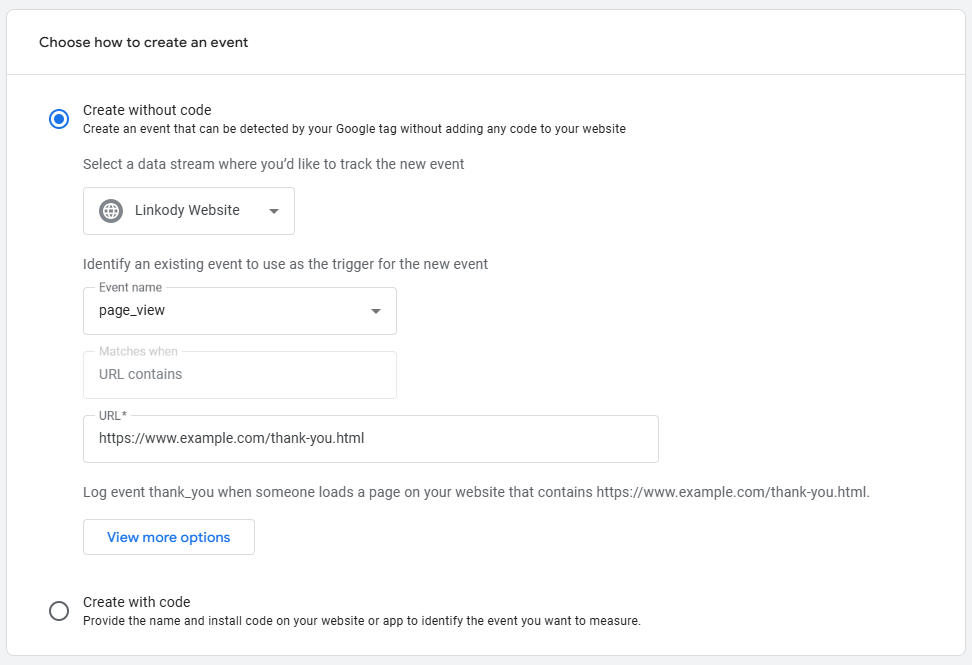
In the “Choose how to create an event” section, select the “Create without code” option. And, from the “Event name” dropdown menu, choose “page_view”.
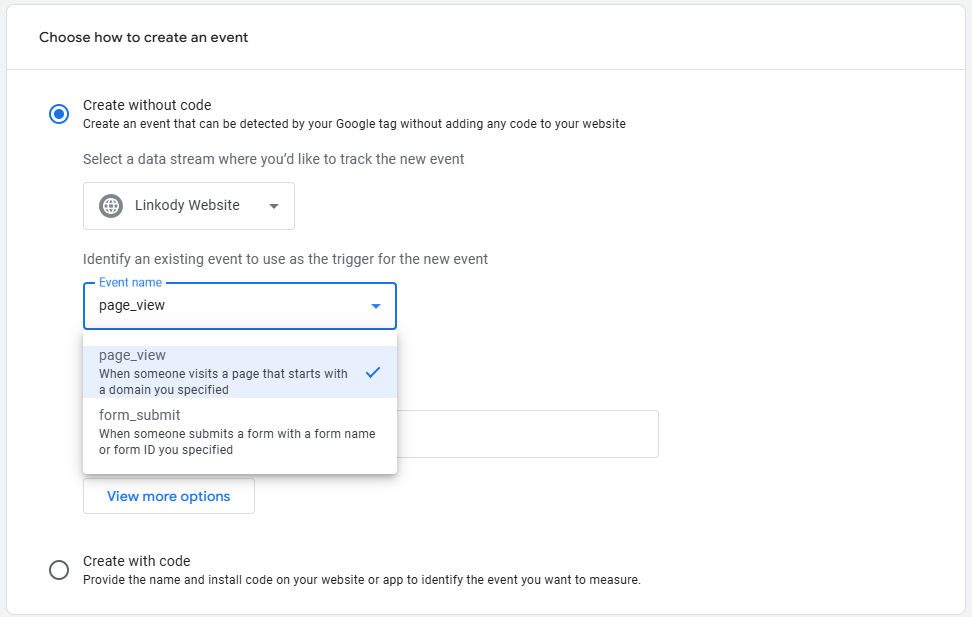
Then, enter the URL in the URL field and click “Create”.
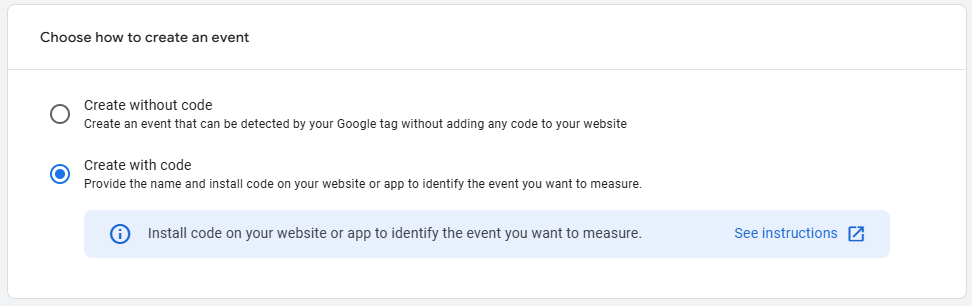
Option B: Creating Events With Code
The first few steps are the same as above.
Open the “Events” tab under “Data Display” on your Admin page. Enter your event name, set your default key event value, and the counting method.
However, in “Choose how to create an event,” select “Create with code.” Install the code on your app or website to identify the events you’re tracking.
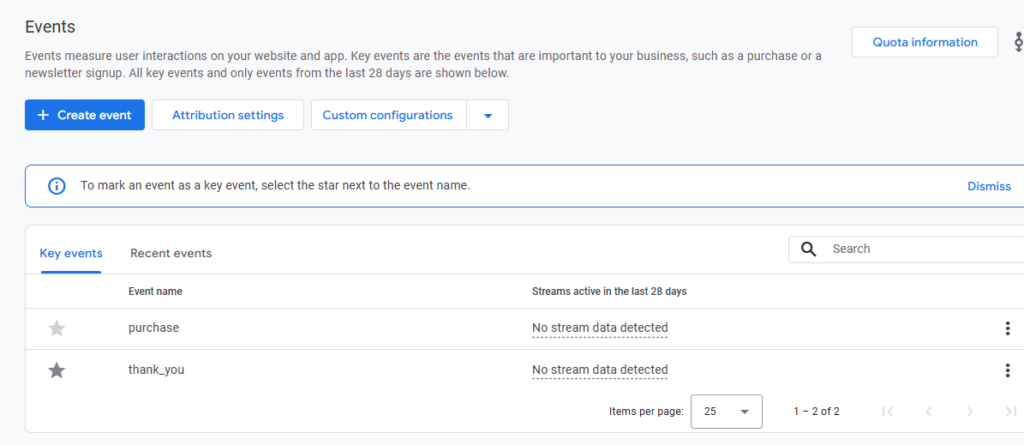
P.S. All your events are stored as “Key events”, which were once known as “conversions”.
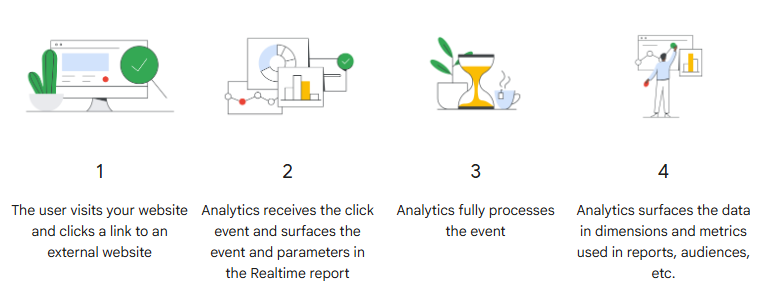
Once your events are set up correctly, the next step is understanding how to interpret the data they generate.
Step 3: Navigate Google Analytics’ Reports
Reports convert raw data into measurable insights. They turn raw numbers into clear insights, helping you understand how visitors use your site or app and how your marketing efforts are performing.
For example, if traffic is increasing but conversions are not, compare acquisition and engagement reports to determine whether the issue lies in targeting or landing page performance.
You’ll find the Reports tab on the left in the navigation bar. You’ll see these types of reports:
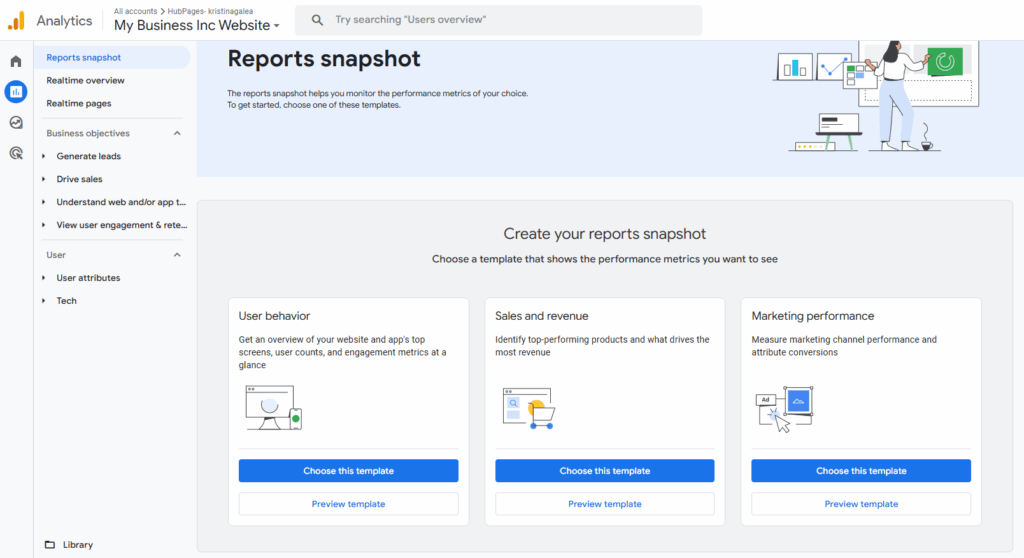
Reports Snapshot Record
The Reports snapshot of Google Analytics 4 serves as the main overview dashboard. If you click on the Reports icon located in the left-hand navigation menu, you will be immediately welcomed by it.
It’s comprised of customizable “summary cards” which provide top-level metrics including trends in user behavior, revenues, and sales figures, as well as marketing performance indicators, based on the format you select.
Each card is linked to a more comprehensive report that lets you look at specific aspects like session count or revenues per user. Since you are able to add, remove, and move these cards around in the Library Reports snapshot, the Reports snapshot can be adapted to show the most important indicator of performance (KPIs) that are most relevant to your company’s objectives, which makes it the ideal start for anyone looking to gain an immediate and comprehensive analysis of their properties’ performance.
Realtime Reports
The Realtime report shows live user activity on your website or app as it happens. It’s perfect for a quick check to confirm that tracking is working well and to spot sudden changes in traffic.
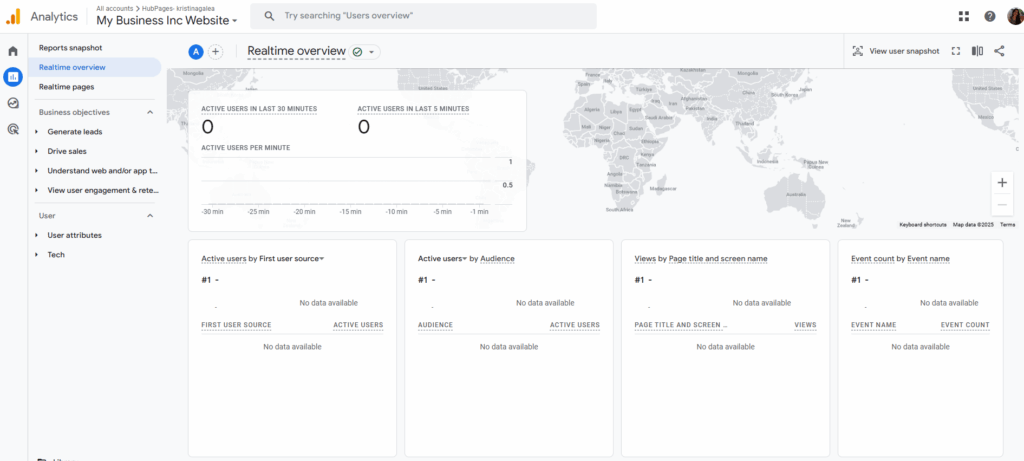
Here’s what a Realtime report can track and offer:
- Active users: See how many people are on your site right now.
- User activity: Watch page views and events like button clicks or form submissions appear within seconds.
- Filters: Narrow down by device category, Traffic Acquisition source, or campaign tags to pinpoint where your visitors are coming from and what they’re doing.
Anyone with access to your Google Analytics can see the same reports on the left-hand side.
However, Google Analytics provides users with two types of reports:
Overview Reports
An overview report provides a high-level summary of a particular topic, using a set of customizable “summary cards” that each pull data from deeper reports. You’ll typically see cards showing your top insights, such as emerging trends, new users by channel, or core engagement metrics, all laid out on a single dashboard.
You can alter the timeframe to measure performance over a variety of time frames, add parallel comparisons (for instance, Android vs. iOS traffic), and include automated insights powered by Google’s machine learning. You can also publish the report as a link or export it to CSV or PDF, and any changes that you make, like changing the order or hiding cards, are available to any user who has access to the report.
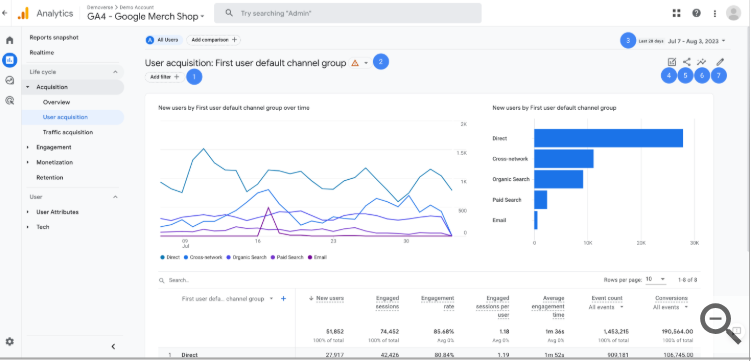
Detail Reports
A detailed report gives you a deep dive into a specific area of your data by combining visual summaries with a fully interactive table. You’ll often have two charts, one showing trends over time and another highlighting key segments or breakdowns so that you can grasp the big picture at a glance.
The report includes a table where you can choose a dimension (such as traffic source, device type, or page path) in the left-hand column and see all its values listed beneath it. The columns to the right present metrics (such as event counts, conversions, or revenue), and you can click any column header to sort the table by that metric.
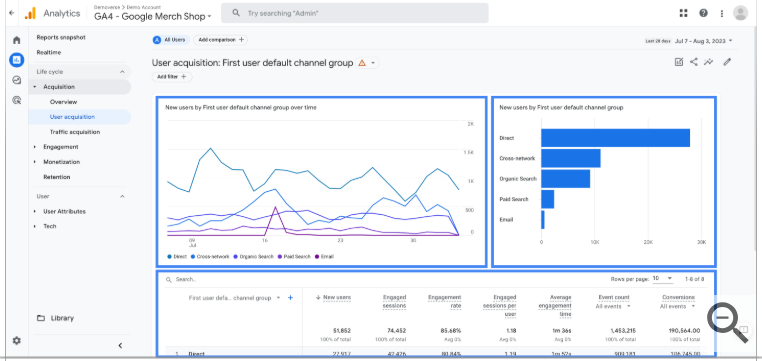
A search box lets you filter the table down to only the rows you want to see. You can also apply filters or comparisons (for example, Android vs. iOS users), adjust the date range, and export or share the report as needed. All together, these features help you pinpoint exactly what’s driving your numbers and where you might focus optimization efforts.
Step 4: Explore Advanced Features and Integrations
Once you’ve mastered the basics of collecting and analyzing data in Google Analytics 4, you can level up by linking other platforms, tapping into powerful new features, and activating your insights across your marketing stack.
Connect Your Advertising and SEO Platforms
By bringing your ad and search data into Google Analytics 4, you see a complete view of how people find and engage with your site.
Link Google Ads
Go to your Admin page, find “Product Links” and click “Google Ads”. Follow the prompts to authorize and select the account you want to connect.
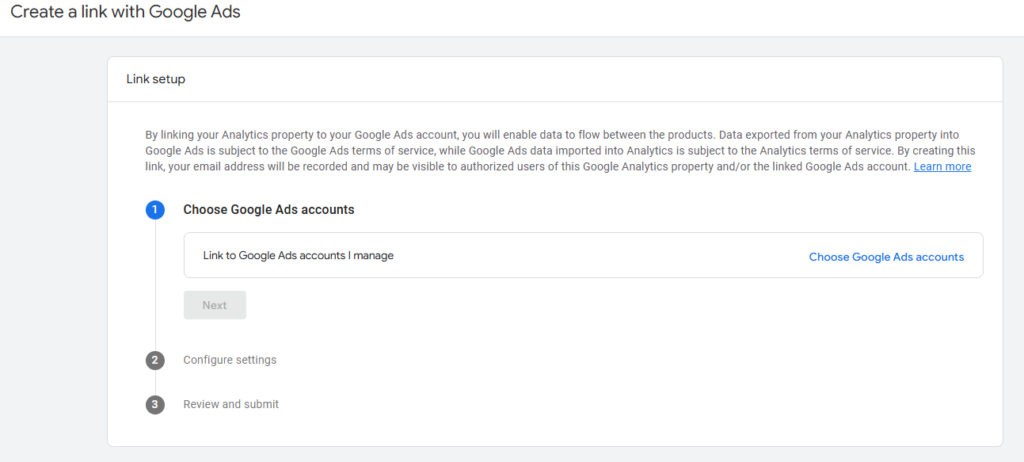
Once linked, you’ll see ad spend, clicks, and conversions alongside your other metrics, so you can measure return on ad spend (ROAS) without jumping between tools.
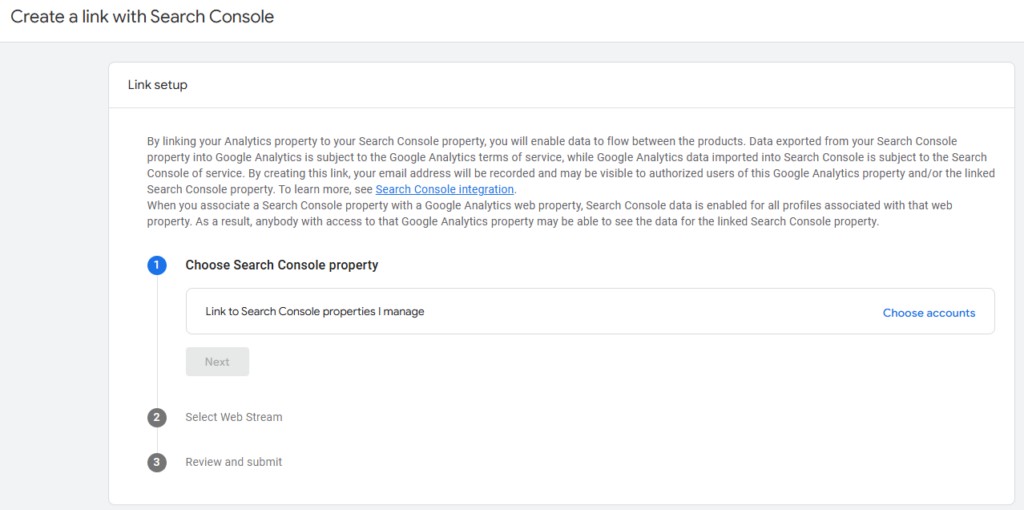
Add Google Search Console
On your Admin page, go to Product Links and click Search Console. Add your link.
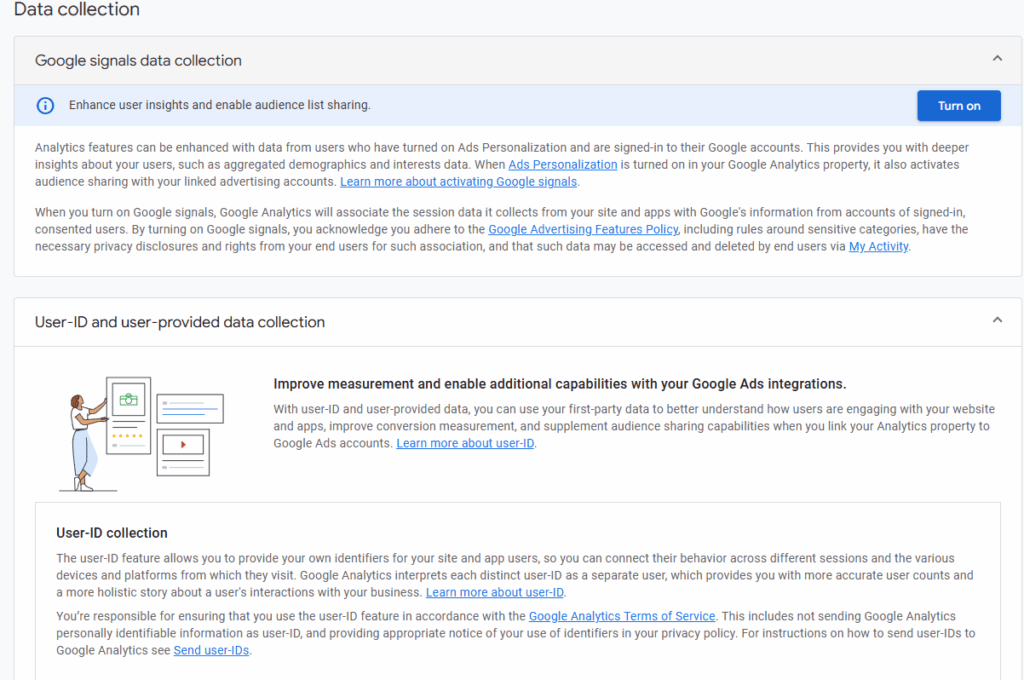
Activate Cross-Device Tracking with Google Signals
Google Signals enriches your data by combining signed-in user behavior across devices. Enable this on your Data Collection page on your Admin.
Once activated, Google Analytics 4 can show how a person is moving between desktop and mobile, create more precise audience segments for remarketing, and provide smarter cross-device attribution to ensure that your marketing campaigns track real-time customer journeys, instead of scattered sessions.
Turn Analytics into Action with Reverse ETL
Once you’ve collected meaningful data in Google Analytics, the next challenge is activating that data across your entire marketing ecosystem. This is where reverse ETL becomes crucial. Unlike traditional ETL (Extract, Transform, Load) pipelines that move data into a warehouse for analysis, reverse ETL moves enriched data out of the warehouse and into operational tools, like CRMs, email platforms, and ad managers.
This allows marketers to design highly customized campaigns, maximize ad spending, and increase customer engagement using actual behavior as well as transactional information. In essence, reverse ETL can close the gap between analysis and action and help you convert insights into a return on investment.
Step 5: Implement These Optimization Tips
Theoretical knowledge is wonderful, but watching it live brings clarity. Let’s look at an actual example:
Users can interact with the site in a variety of ways, based on the site. Let’s consider Newport Academy, a teen treatment facility. The interactions with this site are primarily focused on looking for details. Thus, you’ll need to examine elements like:
- The most visited pages and the time users spend on them.
- The time users spend on key pages and how quickly they leave
- The routes users take to reach Newport Academy.
- The ways they contact Newport Academy
This will allow you to measure and understand user interest so you can optimize your content based on results and better serve your audience.
So, here are a few optimization tips you can use when analyzing your Google Analytics results:
- Analyze traffic acquisition: Compare organic traffic vs. paid from Google Ads. Identify the top traffic sources and adjust your SEO efforts or ad budgets accordingly.
- Refine customer journey: Use customer segments to tailor messaging, for example, visitors from Organic Google Search who viewed the preorder button. Map out the purchase journey and optimize drop-off points using the funnel exploration report.
- Boost engagement: A/B test page elements, such as headlines, search bar placement, and newsletter sign-up prompts, to improve user experience.
Wrapping Up
Mastering Google Analytics doesn’t have to be a technical maze. From getting your tracking code in place to leveraging machine-learning-powered insights and even activating your data via reverse ETL, each step brings you closer to a data-driven marketing strategy.
When you review reports, you’ll notice patterns in user behavior and identify which channels drive the most conversions. Make adjustments to your configuration as your business expands and link your account to other tools to boost your performance.
With these skills under your belt, you’re ready to turn your analytics dashboard into your most powerful growth engine. This Google Analytics tutorial gives you the foundation for tracking performance, analyzing behavior, and improving your marketing decisions.
Looking for more free resources? Head to our blog page to learn more about SEO analytics and reporting.